
Grid and pivot reports are built entirely in the wizard; a document report has a second half. Its data — entity, relationships, fields, filters — still comes from the wizard, but its appearance is drawn in the full report designer: a page-layout surface where you place fields, labels and images into bands and see exactly what will print. Use it for anything where the layout is the product: invoices, purchase orders, statements, certificates. What document reports are and where they surface on records is covered in Document reports; this page is the build procedure.
Prerequisites
- The Reports page of an app you can open; New Document Report sits in its page header.
- A worked-out data plan: the primary entity, the related entities the layout needs (a customer's address, the lines of an order), and the fields to print.
- Ideally, a sample of the target output — an existing printed invoice, say — to design against.
Procedure
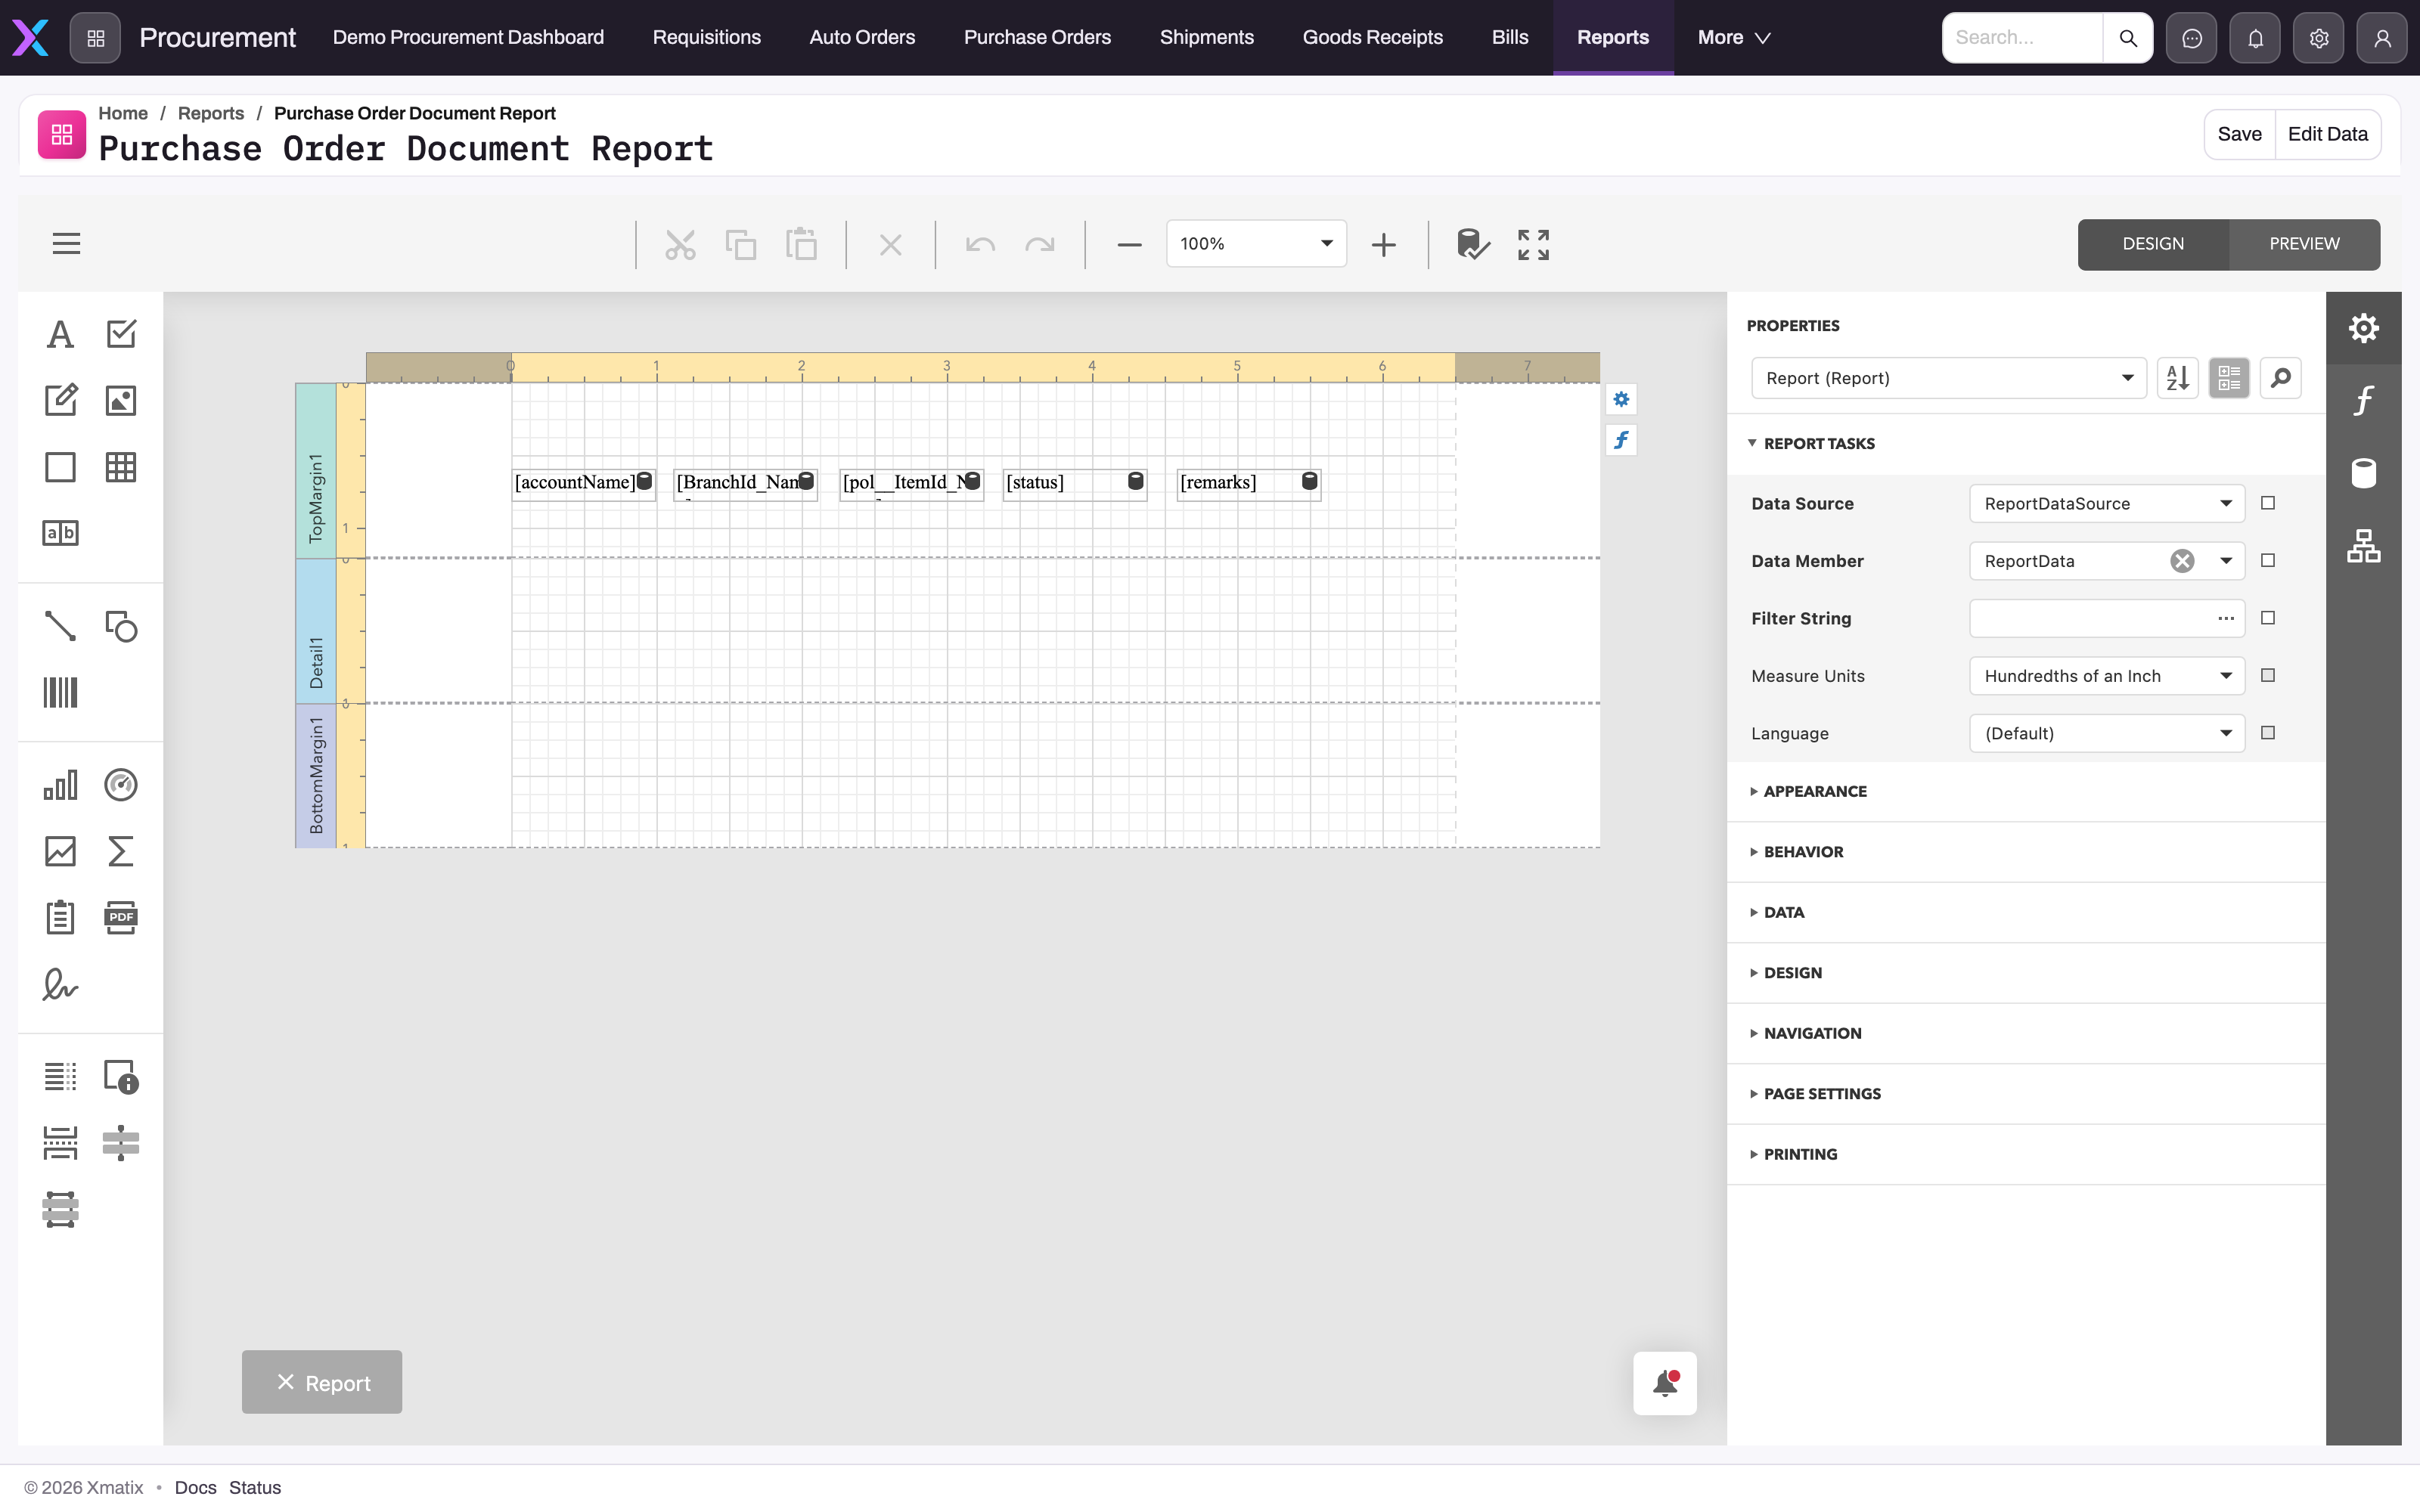
- 1
The toolbox: labels, text, pictures, lines and shapes, tables, barcodes, charts, gauges, sparklines, page info and sub-reports, dragged onto the canvas.
- 2
Bands decide when a control prints: TopMargin and BottomMargin frame the page, Detail repeats once per data row, header, footer and group bands can be added around it.
- 3
Bound fields show their data-field name in brackets; they can only reference fields the Document Report Data wizard supplied.
- 4
Report Tasks in Properties: Data Source and Data Member are wired for you; Filter String, Measure Units and Language, plus Page Settings and Printing below, are yours to set.
- 5
DESIGN / PREVIEW — preview renders with live data through the same renderer the viewer and print path use, so a clean preview is the acceptance test.
- 6
Save stores the layout with the report (toast: '<name> saved'); Edit Data returns to the Document Report Data wizard for the data half.
Step 1 — Create the report and define its data
Open Reports and choose New Document Report. The wizard opens as Document Report Data and walks Data Source, Relationships, Fields, Columns, Display Grouping, Display Summary, Filters and Details — the same steps as a grid report minus Bucketing (see Create a report for each step). Select the primary entity, add only the required relationships, choose every field the document must print, and apply filters that keep the working sample representative. The layout can bind only to fields supplied here, so verify identifiers, line fields, addresses and totals before finishing. Saving the Details step opens the designer with the report title in the page header and the configured data source in the field list.
Step 2 — Get oriented in the designer
The designer is a full-page editing surface. On the left, a toolbox of controls — labels, text, check boxes, pictures, lines and shapes, tables, barcodes, charts, gauges, sparklines, page info, page breaks and sub-reports. In the middle, the canvas is organized into bands — horizontal sections with distinct jobs: the detail band repeats once per data row; header and footer bands print once per page or once per report; group bands open and close around each group of rows; the top and bottom margin bands frame the page. On the right, Properties edits whatever is selected — the report itself (data source, filter string, measure units, language, page settings, printing), a band or a control — and the side rail switches to the expression editor, the field list and the report explorer. The toolbar above the canvas holds cut/copy/paste, undo/redo, zoom and the DESIGN / PREVIEW switch.
Step 3 — Lay out the detail band
Drag data fields into the detail band and arrange them — this band is the heart of the document, the part that repeats for every row. Add static labels for captions, and set formatting (fonts, alignment, number and date formats) on each control.
Step 4 — Add headers, footers and groups
Build the framing: a report header for the title and logo, page headers for column captions that repeat on every page, footers for page numbers and totals. If the data is grouped, group bands let you print a heading when each group starts and summary values when it ends.
Step 5 — Preview with real data
Switch to PREVIEW to render against live data. Inspect a short record, a multi-page record and values near formatting boundaries; verify repeated headers, page breaks, totals, dates, currencies, clipped text and blank related values. Return to Design for each correction and preview again. This renderer is shared with the viewer and print path, so treat a clean preview—not an attractive design canvas—as the acceptance criterion.
Step 6 — Save
Choose Save in the page header; the toast confirms <report name> saved. The layout is stored with the report and the designer reopens on it next time. Edit Data beside it returns to the Document Report Data wizard when the data half needs a change.
Step 7 — Run it
Return to the report library, open the saved report and verify it renders in the paginated viewer — page navigation, zoom presets from 50% to 200% plus Page Width and Whole Page, continuous-pages toggle, print, and export as PDF, Excel, Word, CSV, HTML, RTF, Text or Image. Export one test copy and compare it with the approved sample. If the document will be record-driven, wire it to the intended entity action and test Print or Preview from a disposable invoice or order; do not assume a library run proves the record-action binding.
Expected result
The report reopens with its saved bands and controls, preview renders representative records with correct pagination and formatting, and the library viewer produces the same output. Any configured record action opens the intended report with the current record context and no missing-field or blank-binding errors.
Common problems
- The designer has no fields to place. The data half is empty or too thin — go back through the wizard (Edit) and select the fields the layout needs. The designer never invents data; it lays out what the wizard defined.
- A control prints blank. It is bound to a field that is no longer part of the data definition — usually removed in a later wizard edit. Re-add the field in the wizard or rebind the control.
- "This report is not a document report." The id being opened belongs to a grid or pivot report. Only document-format reports have a designed layout; the other formats are configured wholly in the wizard.
Common questions
What edits go in the wizard and what goes in the designer?
The wizard owns the data: entity, relationships, fields, filters, name and folder. The designer owns the appearance: bands, placement, fonts, page setup. In the Setup analytics screen the two are separate row actions — Edit Report for the data and properties, Design Report for the layout — and changing one never silently rewrites the other.
Can a document report print a specific record?
Yes — that is its main job. A Print or Preview action on an entity passes the current record's identifier to the document report, which renders just that record: one invoice, one purchase order. Run from the library without a record context, the report renders whatever its own query and filters return. Details in Document reports.
Can a document report be delivered by email on a schedule?
Yes. Subscriptions work for document reports like any other — the scheduled export renders the designed layout as PDF or Excel, or Embedded in the email body (CSV is offered for grid reports only), so the attachment is the same document the print path produces.