
A report in xMatix is a saved query with presentation: which entity it reads, which related entities it joins, which columns it shows, how rows are grouped, summarized and filtered. Nothing is copied or staged — every time a report opens, its query runs live against your organization's data, so what you see is current as of that moment. Reports are built in the report wizard, shared through an explicit visibility list, and can be emailed on a schedule.
The report library
- 1
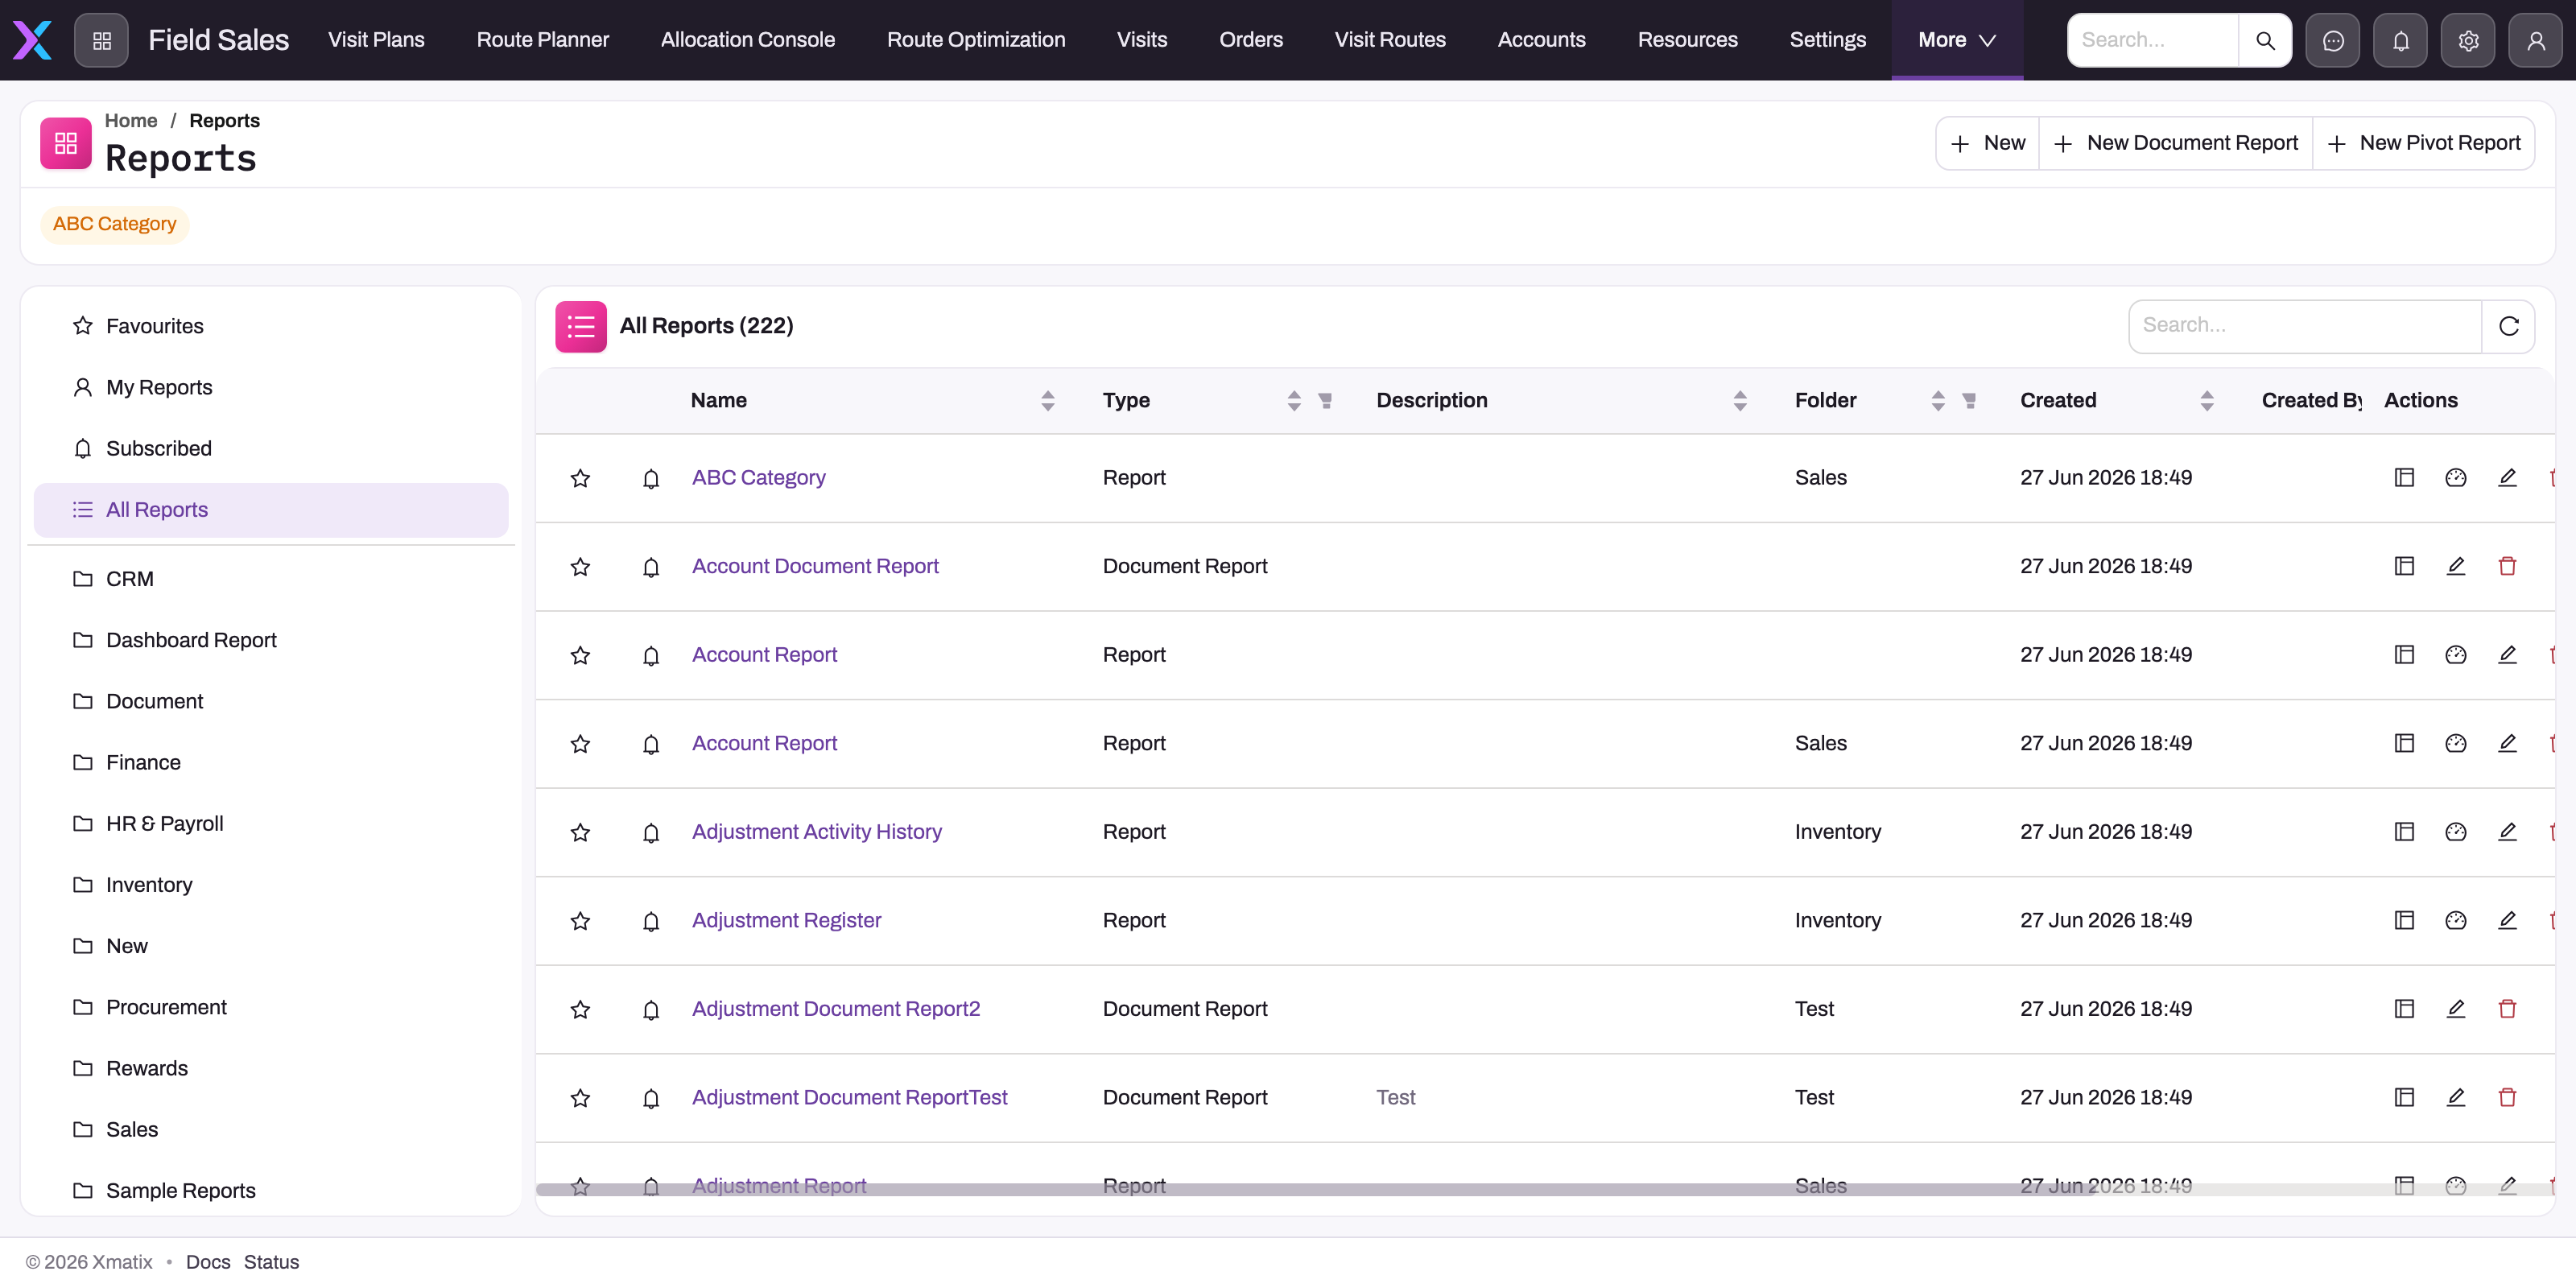
New starts a grid report, New Document Report a print layout that continues into the designer, New Pivot Report a cross-tab — the format cannot be switched after creation.
- 2
Favourites and Subscribed are your personal flags; My Reports does not yet filter by owner and lists the same rows as All Reports.
- 3
Folders are plain names set on each report (Parent/Child nests them); a report filed in several folders appears under each.
- 4
The star pins a report into Favourites; the bell opens the Subscribe dialog and is filled when a subscription already exists.
- 5
Type reads Report (grid), Document Report or Pivot Report and is filterable; click the name to open the viewer for that format.
- 6
Row actions: Design (wizard or layout designer), Create dashboard (grid reports only), Edit (name, description, folder, visibility) and Delete.
Reports in an app's navigation opens the library. The left-hand menu scopes the list — Favourites, My Reports, Subscribed, All Reports — and below the scopes sit the folders, one entry per folder in use, nested where folder names contain a sub-folder. The page header carries the three creation actions, one per format: New (a grid report), New Document Report and New Pivot Report. Each opens the wizard for that format; New Document Report continues into the layout designer once the data is defined.
The table shows Name, Type (Report, Document Report or Pivot Report, filterable), Description, Folder (filterable), Created, Created By, Modified, Modified By and an actions column. Clicking a name opens the report in the viewer for its format. Two per-row toggles sit before the name: the star adds the report to your Favourites and the bell opens the Subscribe dialog (filled when a subscription already exists). The row actions are:
| Action | What it does |
|---|---|
| Design | Reopens the definition for editing — the wizard for grid and pivot reports, the layout designer for document reports. |
| Create dashboard | Grid reports only: starts a new dashboard with this report as its first data source. |
| Edit | Opens the properties dialog: Name, Description, Folder and Visibility (Only me / All users / Selected users with roles, profiles and teams). This is where a report is shared. |
| Delete | Removes the report permanently after a confirmation. |
Two things the library does not do. It shows only reports you are allowed to see — a report someone else created and never shared is not listed at all, and neither is a deactivated report. And My Reports does not currently apply an owner filter: it lists the same reports as All Reports, so use the Created By column, not the scope, to find your own.
The three report formats
| Format | What it is | Typical use |
|---|---|---|
| Grid (Report) | An interactive table — sortable, groupable, filterable, with summaries and optional bucketing columns | Operational lists: open orders, overdue invoices, stock by branch |
| Pivot | A matrix that cross-tabulates rows against columns with aggregated measures | Sales by product by month, counts by status by team |
| Document | A designed, paginated layout built in the full report designer | Invoice and purchase-order print formats, statements — see Document reports |
The format is chosen when the report is created — each New action starts one format's wizard — and cannot be switched afterwards. Each format opens in its own viewer.
Viewing a grid report
- 1
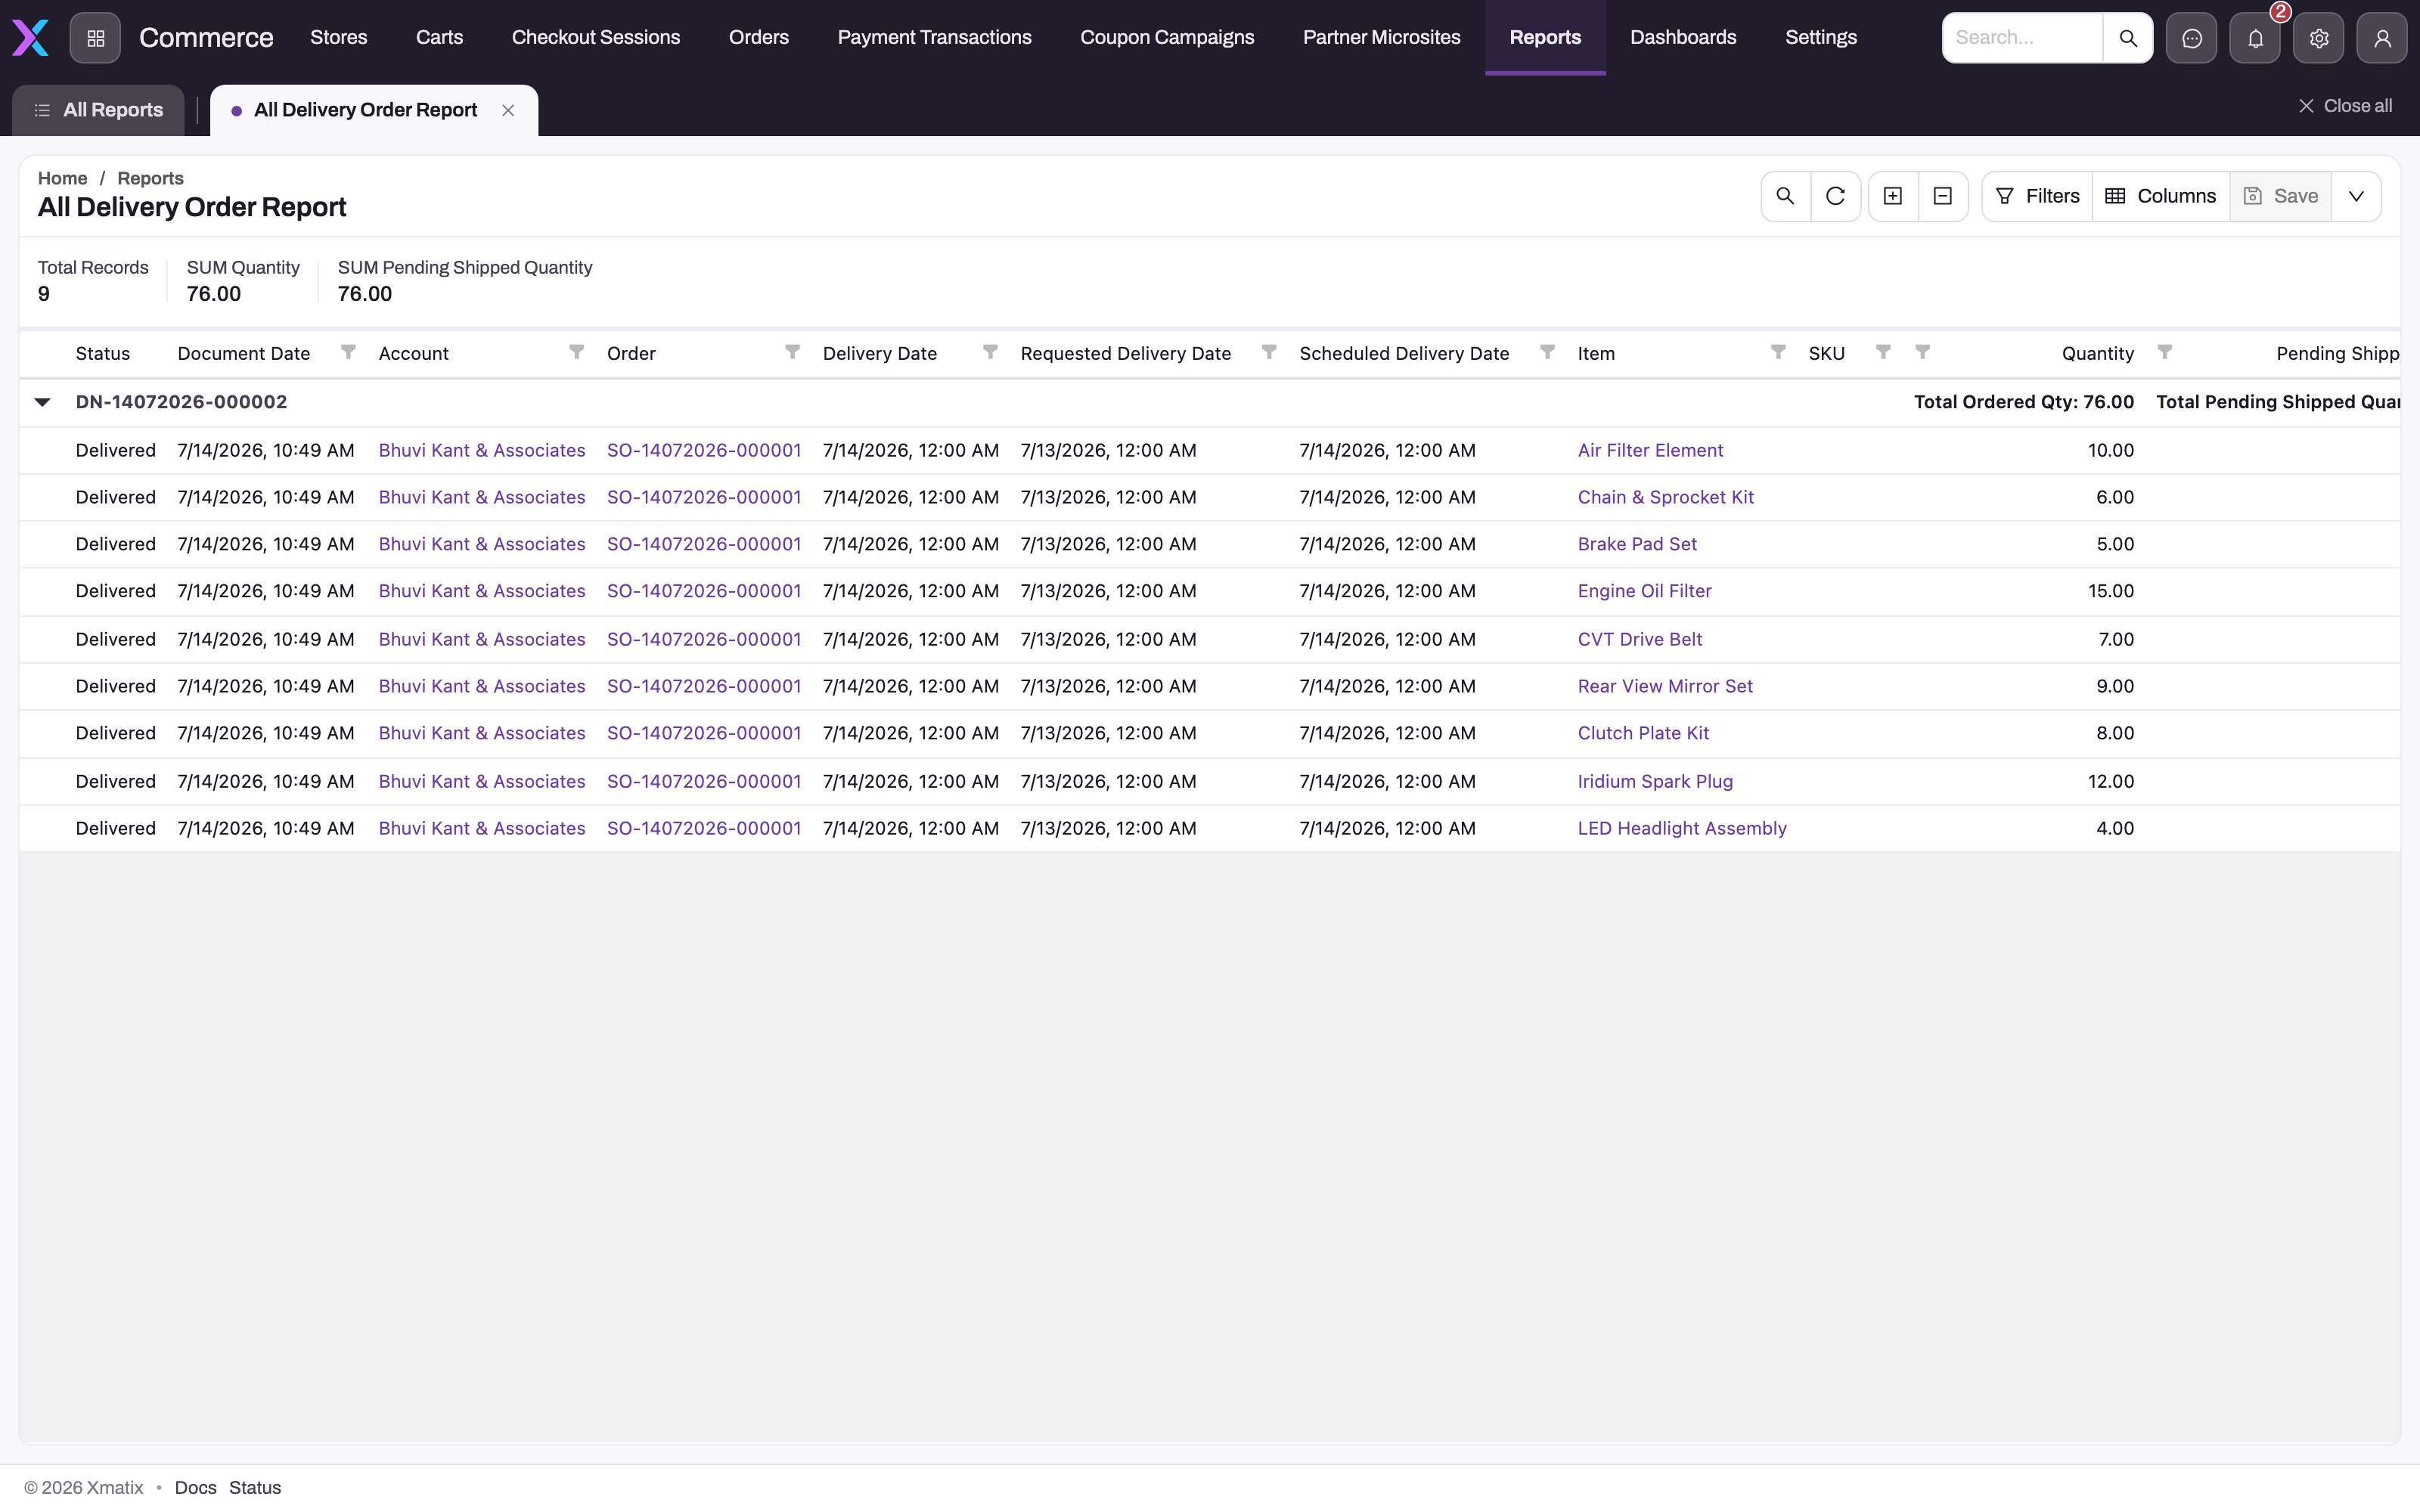
Total Records and the author's summaries (here SUM Quantity and SUM Pending Shipped Quantity) are computed over the whole result, not just the rows on screen.
- 2
A grouped report shows one heading row per group — this delivery note — with the group's subtotals on the right; the arrow collapses it.
- 3
Search and refresh re-run the query; the expand and collapse buttons open or close every group at once.
- 4
Filters adds your own conditions on top of the report's built-in ones and Columns shows, hides and reorders; Save writes the arrangement into the shared report definition for everyone.
- 5
The menu carries Export to Excel, Export to PDF, Edit (wizard), Clone, Add to favourites, Subscribe and Delete.
- 6
Reports open as workspace tabs beside All Reports, so several reports can stay open while you compare them.
Opening a grid report runs its query and loads rows into the table in pages as you scroll, so large reports open quickly. The header shows Total Records and any report-level summaries the author defined (a SUM Quantity, for example); grouped reports show a heading row per group with its own subtotals, and the toolbar's expand and collapse buttons open or close every group at once. The toolbar also offers search, refresh, Filters (your own conditions on top of the report's built-in ones), Columns (show, hide and reorder) and Save.
Save is a shared change, not a personal view. It writes the current column arrangement, grouping, sort and filter state back into the report definition (the toast reads Report saved), so everyone who opens the report next sees what you saved. Use it to tidy a report you own; for a private variation, Clone the report and adjust the copy instead. Unsaved arrangements are remembered only in your browser for the session.
The toolbar's menu carries the report-level actions: Export to Excel and Export to PDF (the current result, with your filters applied), Edit (reopens the wizard), Clone, Add to favourites, Subscribe and Delete. Reports whose author promoted filters show them as a filter bar above the grid, so a viewer can change the period or branch without opening the filter builder.
Viewing pivot and document reports
A pivot report opens as a matrix: the fields the author placed on rows and columns form the axes, and the measures aggregate in the cells; it exports to Excel and PDF like a grid. A document report opens as paginated pages rendered from its designed layout, with page navigation, zoom, print and export — but most document reports are reached from a record's Print or Preview action rather than from the library, because run without a record they render whatever their own filters return; see Document reports.
Folders, favourites and subscriptions
Folders are names stored on the report, not a managed hierarchy: a report's Folder is set in the wizard's Details step or the row's Edit dialog, and a name that does not exist yet creates the folder. The library reads a path as who it is for, then what it is about — Sales Manager/CRM files the report under the Sales Manager persona with a CRM sub-folder, a plain Sales is a flat folder — and one report can be filed under several paths at once without being copied. Marking a report as a favourite pins it into your Favourites scope — the flag is personal, not shared. Subscribing puts the report in your Subscribed scope and emails it to you on a schedule — as PDF, Excel, CSV or embedded in the message body for a grid report; the mechanics, formats and limits are on Subscriptions.
What runs when a report opens
The report's query runs against live records. Two access checks apply: the report itself must be visible to you (active, and shared with you or created by you), and the entities it reads are read as the platform's query layer exposes them. The report's built-in filters and joins define the result set; your own viewer filters narrow it further for you alone. Because the query is defined by the author, the audience you share a report with sees the rows that query returns — a point that matters when sharing a report over sensitive data.
Common questions
Who can see a report I create?
Only you, until you share it. A new report — and a clone of an existing one — starts visible to its creator alone; other users, including administrators browsing the Reports menu, will not see it listed. Sharing is a deliberate act from the row's Edit dialog: everyone, or selected roles, profiles and teams. The full model is in Sharing & access.
Can I start from an existing report instead of a blank one?
Yes — Clone in the report viewer's actions menu copies the definition. The copy belongs to you and starts private, so you can rename it, adjust columns and filters through the wizard, and share it when it is ready, all without touching the original.
What is the difference between deactivating and deleting a report?
Deactivating — the Active switch in Setup → Data Studio → Analytics → Reports → Edit Report — hides the report from every user's library, including its creator's, while keeping the definition and sharing intact so it can be reactivated later. Existing subscriptions are not paused by deactivation: they keep sending until the subscriber unsubscribes or the report is deleted. Deleting removes the report permanently and ends its deliveries. Before deleting, check whether any dashboard uses the report as a widget source: those widgets lose their data when the report goes.
Does Save in the viewer change the report for everyone?
Yes. Save in the viewer toolbar writes your column, grouping, sort and filter arrangement into the report definition itself, so it is the same as editing the report in the wizard. There is no per-user saved view for reports today; if you want a variation without touching the shared report, Clone it and save your arrangement on the copy.
Why does my report show fewer rows for a colleague than for me?
Usually because the colleague has unsaved viewer filters applied, or because they are looking at a different report of the same name — the library allows duplicate names in different folders. The report's own rows are defined by its query, not by who opens it; if the counts differ with no filters set, compare the two reports' definitions.