
Building a dashboard is composition: choose the source appropriate to each widget, decide how to visualize it, and arrange the canvas. Native KPI and chart widgets read an entity, a report or a materialized dataset; the palette also includes report tables, embedded reports, maps, navigation buttons and text. The first step happens before the designer opens — confirming each source exists, returns the intended data and is accessible to the people who will view the dashboard.
Prerequisites
- Permission to create dashboards (the New Dashboard action in the Dashboards page header).
- The intended sources, tested independently: entity data, a materialized Data Studio dataset, or a report, depending on the widget.
- A plan for the audience: dashboard visibility and each source's own access rules must all admit the viewer. Report-backed widgets require the report to be shared; entity- and dataset-backed widgets require access to those records or datasets.
Procedure
Step 1 — Create the dashboard
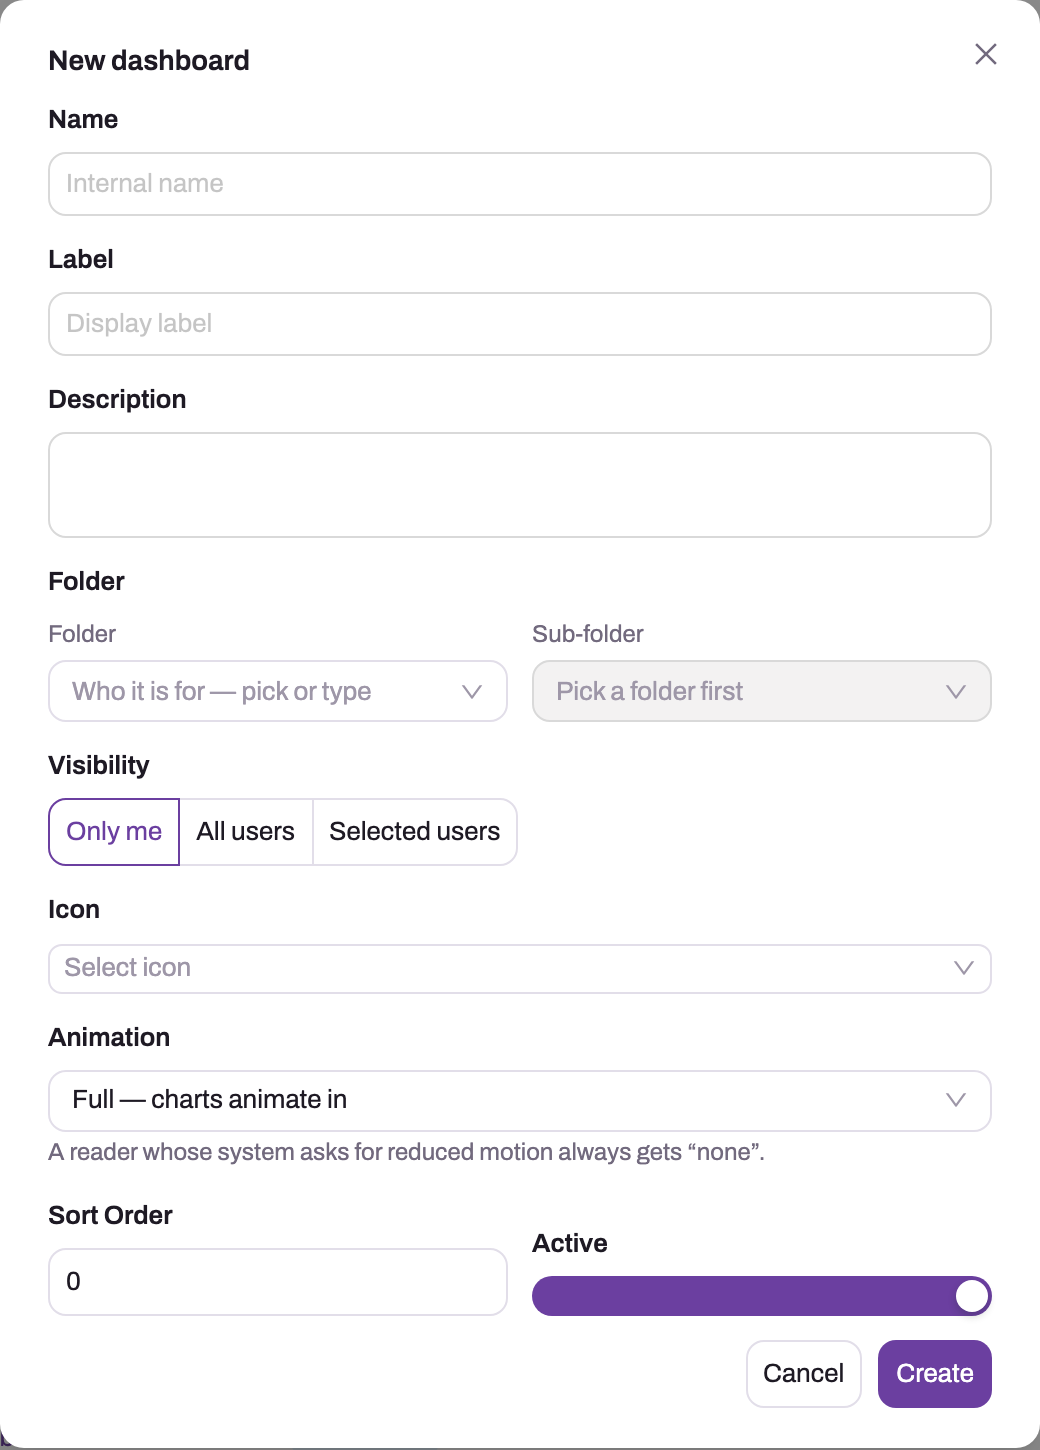
Open Dashboards and choose New Dashboard in the page header. The New Dashboard menu also offers From Entity and From Dataset, which pre-build a starter layout over one source; the plain action starts from an empty canvas.
- 1
Name is the stable internal identifier; Label is the title readers see in the menu and on the canvas.
- 2
Folder (who it is for) and Sub-folder place the dashboard in the Dashboards menu tree — pick an existing folder or type a new one.
- 3
Visibility: leave Only me while building; All users opens it to everyone; Selected users asks for at least one role, profile or team.
- 4
Icon and Animation are presentation only — Animation sets how charts enter (Full, Subtle, Fade in together, Grow from the axis, Fast, Slow or None); readers with reduced motion always get None.
- 5
Sort Order positions it within its folder; Active off hides it from readers without deleting it. Create saves the definition and opens it.
| Field | What it does |
|---|---|
| Name | Stable internal identifier. |
| Label | The title readers see in the Dashboards menu and on the canvas. |
| Description | Shown in the menu; say who the dashboard is for. |
| Folder / Sub-folder | Where it sits in the Dashboards menu tree — pick an existing folder or type a new one; the sub-folder unlocks once a folder is chosen. |
| Visibility | Only me (default), All users, or Selected users — the last asks for at least one role, profile or team and refuses to save with none. |
| Icon | Menu icon; presentation only. |
| Animation | How charts enter: Full, Subtle, Fade in together, Grow from the axis, Fast (for heavy filtering), Slow (for a wall board) or None. A reader whose system asks for reduced motion always gets None. |
| Sort Order | Position within its folder. |
| Active | Off hides the dashboard from readers without deleting it. |
Leave visibility on Only me while building. Create saves the definition and opens it; a new dashboard starts with an empty canvas and stays private until you deliberately change visibility (Edit on the dashboard reopens this dialog).
Step 2 — Enter design mode
Open the dashboard and choose Design. The viewer switches into the designer: the same canvas, now editable, with the widget palette, page rail, filter editor and a settings drawer per tile. A Desktop / Phone switch lets you lay the same tiles out separately for narrow screens.
Step 3 — Add a tile and bind its data
Add a widget from the palette: KPI, Chart, Table (report), Report (embedded viewer), Map, Buttons (navigation) or Text. For a KPI choose Entity or Report as the source; a chart additionally accepts Dataset. Report and dataset selectors list only definitions you can access; an entity-backed widget still runs under entity and record security. A live-data toggle renders every tile with real, permission-scoped data while you design; off, each tile shows a one-line summary so heavy dashboards stay responsive.
Step 4 — Bind fields
Assign fields and measures to the widget's supported slots in its settings drawer: category and value series for charts, the measure and aggregation for a KPI (with optional colour bands and weights), columns for a table, or the selected report for an embedded viewer. Calculated fields and hierarchies (drill paths such as region → branch) are defined in the designer and then offered as fields. Repeat for each widget, resizing and arranging as you go. A source type does not make every field valid for every widget, so use the drawer's offered fields rather than typing assumptions.
Step 5 — Add filter elements
Use the Dashboard filters editor in the designer toolbar to configure the filter bar. Filters are dashboard controls, not draggable tiles on the canvas. A branch and period filter can let one dashboard replace a family of near-duplicates; verify that each target widget recognizes the chosen field and value type — the editor shows which tiles a filter reaches. Clicking a chart's bar or slice also filters the same-entity tiles to that group instead of opening the entity list.
Step 6 — Optional pages, alerts and style
The page rail lets a dashboard hold several pages; a page can also be marked as a tooltip page, which is never opened directly but drawn beside a point when a reader hovers a chart that names it. Alerts attach threshold conditions to tiles, Saved views capture page-plus-filter states readers can return to, and Dashboard style sets the canvas theme.
Step 7 — Save and review
Save from the designer, then leave design mode and read the dashboard as a viewer will. When the design is dirty, the close action becomes Discard & close and leaves immediately; there is no extra confirmation dialog. Save before using it unless you intentionally want to discard the current edits.
Step 8 — Share it — twice over
Share the dashboard with its audience (Edit → Visibility), then verify the access path for every widget source. Share each backing report with the same audience; grant appropriate dataset access for dataset-backed widgets; and confirm the viewer's entity, field and record permissions for entity-backed widgets. The dashboard cannot widen any of those source permissions. The mechanics are in Sharing & access.
Expected result: the dashboard opens outside design mode with every tile populated, shared viewers can discover it in their Dashboards menu, and those viewers also have access to each backing report.
Reading and working with the finished dashboard
The viewer toolbar offers Design (for people allowed to edit), Clone (copy under a new name and design your own), Comments, Change history, Views (saved page and filter states, including Save current view…), Find a tile, and Export as PDF or PNG image — the export matches the filters on screen. Each tile can be focused full-width. Where dashboard subscriptions are enabled for the deployment, a Subscribe action schedules delivery of the rendered dashboard.
Common problems
- The expected source is absent. Check the widget's supported source types first, then verify that the report or dataset exists and is visible to you. For Entity, confirm the entity is available under your permissions.
- Widgets are empty for other people but fine for you. Test the source type: share a backing report, grant the dataset access, or correct the viewer's entity and record grants. Sharing only the dashboard is never a source-access bypass.
- The viewer says the definition is invalid. The stored layout was damaged or edited outside the designer. The viewer reports that the definition is invalid rather than silently showing a blank canvas. Repair or rebuild it in the designer; never edit the stored definition by hand.
- The dashboard is missing from someone's menu. Check Visibility (Only me is the default), the Active switch, and that the viewer has at least one of the selected roles, profiles or teams.
Common questions
Can two people design the same dashboard at the same time?
Avoid it. A designer save writes the whole layout, so when two people design concurrently, the last save wins and the other person's changes are overwritten — there is no merge. Coordinate edits, or clone-and-replace instead of editing live. Change history shows who saved what, so an overwrite can at least be traced.
Do viewers need access to the reports behind the tiles?
Only report-backed widgets do. The dashboard's own visibility controls whether it is listed and opens, but each widget still uses its source's authorization: report visibility for reports, dataset access for materialized datasets, and entity/field/record security for entities.
Is the dashboard live, or a snapshot?
Live for the reader: each tile queries under that viewer's access when the dashboard opens or a filter changes, so two people can see different numbers from the same tile. Exports and scheduled deliveries are point-in-time renderings of what was on screen.